

Most social teams think they’re reporting on social media analytics, but all they’re doing is dashboard-watching.
Someone opens LinkedIn, screenshots the follower count, pastes it into a slide, and calls it a report. Maybe they add impressions and likes for good measure. The deck goes to leadership, leadership nods, and nothing changes.
That’s dashboard-watching: collecting numbers that feel productive without connecting them to anything the business needs to decide.
I’ve spent over a decade working with marketing and comms teams across three continents, and the problem I see most often isn’t a lack of data. Every platform gives you more data than you’ll ever need. The challenge is knowing which numbers matter, what they’re telling you, and what to do about it.
What social media analytics actually means
Social media analytics is the practice of collecting and interpreting data from your social platforms to make better decisions about your content, strategy, and budget.
It’s a discipline, not a tool or dashboard. Think of it in three layers:
| Layer | Question it answers | Where most teams operate |
| Descriptive | What happened? | ✓ Most teams stop here |
| Diagnostic | Why did it happen? | Some teams reach this |
| Prescriptive | What should we do next? | Few teams get here |
Dashboard-watching lives entirely in the first layer. Productive analytics moves through all three.
There’s also a useful separation between analytics and monitoring:
Monitoring is watching what people say about you online: brand mentions, comments, sentiment.
Analytics is measuring how your own content and strategy perform over time.
Both serve a purpose, and conflating them leads to reports that feel thorough but inform nothing.
Without analytics, every content decision is a guess. With analytics, those decisions have evidence behind them. That evidence lets you make the case for social media investment to the budget-holders.
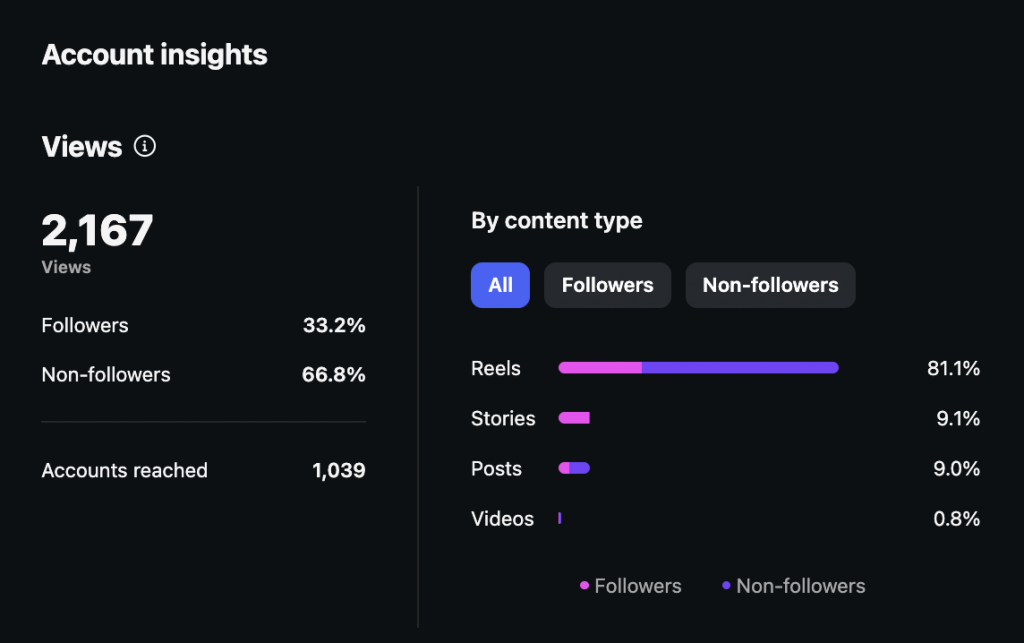
The social media metrics that actually matter
Your platform dashboard will happily show you dozens of numbers. Most of them are traps. I split them into surface metrics and decision metrics.
Surface metrics
Useful for context, dangerous as the headline:
| Metric | What it tells you | The trap |
| Follower count | Size of your potential audience | Says nothing about quality or engagement |
| Impressions | How often content was displayed | Easily inflated; one person generates multiple impressions |
| Likes | Passive positive response | Low friction, low intent, low predictive value |
Decision metrics
The ones worth reporting:
| Metric | What it tells you | Why it matters |
| Engagement rate | % of viewers who interacted | Most reliable indicator of content relevance |
| Click-through rate (CTR) | How often viewers take action | Bridges social activity to business outcomes |
| Follower growth rate | % audience growth over time | More useful than raw follower numbers |
| Reach | Unique accounts that saw a post | Better than impressions for understanding spread |
| Conversion rate | Social activity producing a business outcome | Connects social directly to revenue or pipeline |
| Share of voice | Your brand’s visibility vs competitors | Shows competitive position, not just internal performance |
A useful benchmark: engagement rate, conversions, sentiment, and share of voice are the metrics that help enterprise teams prove ROI and justify budget to leadership. If your current report doesn’t include at least two of those, you’re dashboard-watching.
How to track social media analytics
Productive tracking comes from having a process, not a fancier tool. Here’s the process I recommend.
Step 1: Define your question before you open any dashboard.
The most common analytics mistake is opening a platform, looking at whatever numbers appear first, and calling that analysis. Instead, start with a specific question: are we trying to grow awareness, drive traffic, generate leads, or build community? The metrics you track should answer that question—don’t just track every metric on the platform.
Step 2: Set a baseline.
You can’t evaluate performance without a reference point. Pull the last 30, 60, or 90 days of data before making any strategic changes. Every future result gets measured against that baseline.
Step 3: Track on a consistent schedule, not sporadically.
One good month doesn’t indicate a trend. Three consecutive months of improvement does. Pick a reporting cadence—weekly for active campaigns, monthly for always-on activity—and hold to it.
Step 4: Start with native tools.
LinkedIn Analytics, Meta Business Suite, and TikTok Analytics are sufficient for most small and mid-size organisations. Third-party tools like Hootsuite, Sprout Social, or Brandwatch add value when you’re managing multiple platforms, need cross-channel reporting, or require social listening at scale. Don’t pay for complexity you haven’t outgrown yet.
How to understand what your analytics are telling you
Here are four scenarios you might recognise from your own dashboards, and what each one is actually telling you.
Scenario 1: High impressions, low engagement rate
Your content is getting displayed but people aren’t interacting. The content is visible but not relevant or compelling enough for your audience to respond. Look back at the last 90 days and find your three highest-engagement posts. What did they have in common in terms of format, topic, tone, and posting time? Shift your content mix toward those patterns.
Scenario 2: Strong engagement rate, low reach
The people who see your content like it, but not many people are seeing it. Your content quality is solid but your distribution is limited. Consider boosting your top-performing organic posts with paid amplification, even with a modest budget. Also review your posting frequency: algorithms on most platforms reward scheduled consistency, and an irregular posting schedule can suppress reach regardless of content quality.
Scenario 3: High CTR from social, low conversion on the landing page
Social media is driving traffic, but that traffic isn’t converting. The problem is what happens after the click. Review the alignment between what your social content promises and what the landing page delivers, or whether your CTAs (calls to action) are sufficiently clear.
Scenario 4: Follower count growing, but engagement rate dropping
Your audience is getting bigger but less engaged. You’re attracting followers who aren’t interested in your content, or your content has drifted from what originally attracted your core audience. Audit the content that drove your strongest historical engagement and return to those themes. A growing but disengaged audience is the clearest possible sign of a vanity metric problem.
How to tie social media analytics to your other systems
Dashboard-watchers almost never connect what they’re seeing on social to what’s happening in the rest of the business.
Your social analytics tell you what happened on the platform, but your other systems tell you what happened in the business as a result. You have to read both together for any useful insights.
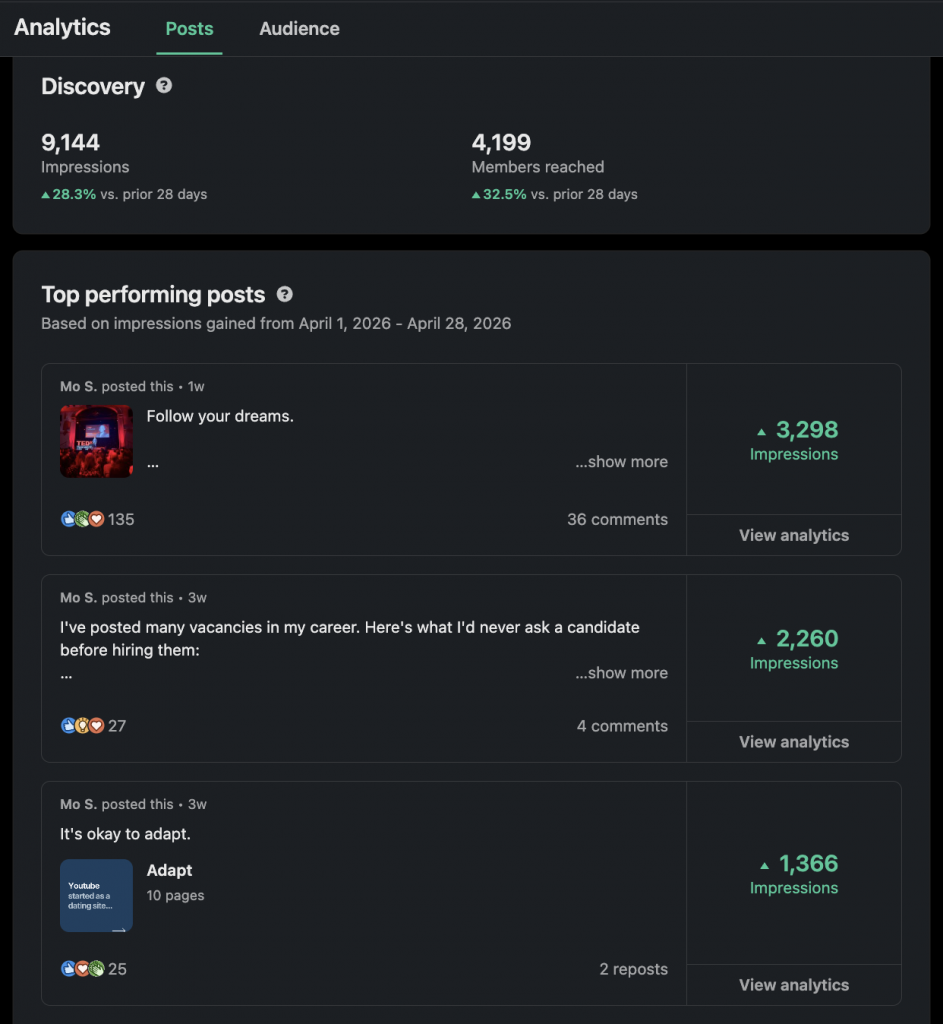
Website traffic (Google Analytics / Google Search Console)
If your social engagement is climbing, you should see a corresponding uptick in referral traffic from social channels in GA4. If you’re not, it means engagement is staying on-platform: people are liking and commenting but not clicking through. Cross-reference your top-performing social posts with the dates on which referral traffic spiked. You’ll quickly see which content types move people from social to your site, and which ones just generate warm feelings that go nowhere.
Sales and revenue (Shopify, CRM, or checkout forms)
Check whether spikes in social engagement correlate with spikes in sales. Shopify’s traffic source reports show you how much revenue social channels are directly attributing. For businesses with longer sales cycles, a simple “How did you hear about us?” field on your enquiry or checkout form captures attribution your analytics tools can’t, because people often discover you on LinkedIn, think about it for two weeks, then convert through a direct search. That conversion says ‘organic’ in GA4, but it started on social.
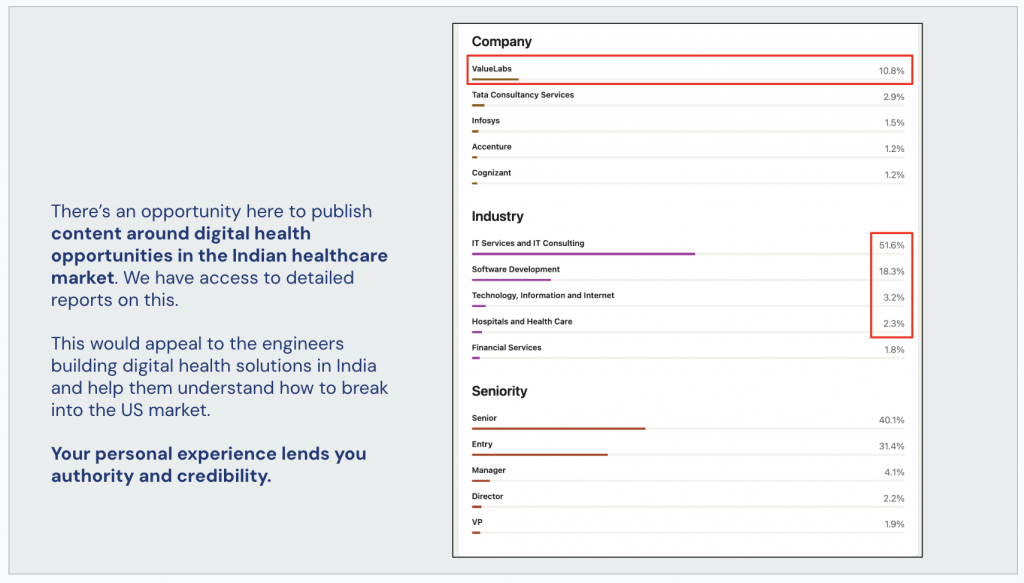
Recruitment (ATS or candidate intake forms)
If you’re a larger organisation actively hiring, your LinkedIn presence directly influences candidate quality and volume. Add “How did you hear about this role?” to your application form and track how many candidates cite LinkedIn or other social platforms. A strong employer brand on social reduces recruitment costs and attracts candidates who already understand what your organisation does, and that’s entirely measurable if you build the right intake questions.
Customer sentiment (CRM and support tickets)
If a social campaign generates a spike in inbound customer service queries, complaints, or compliments, those signals will appear in your CRM or helpdesk tool before they show up clearly in your social analytics. Connecting the two lets you correlate specific content with downstream customer behaviour, which is more useful than measuring likes on the post that triggered it.
| If you see this on social | Check here too | What you’re looking for |
| Rising engagement | GA4 referral traffic | Corresponding traffic spike from social sources |
| Viral or widely-shared post | CRM / support inbox | Spike in inbound enquiries or customer questions |
| LinkedIn follower growth | ATS application source data | More candidates citing LinkedIn as discovery channel |
| Increased profile visits | Shopify / checkout form | “How did you hear about us?” responses citing social |
| Positive sentiment spike | Sales pipeline / CRM | New leads or opportunities created in the same period |
How to report social media analytics to leadership
Leadership doesn’t care about engagement rates. They care about what those rates mean for the business. Your job when reporting upward is to translate metrics into outcomes, and that requires a different structure than a screenshot of your dashboard.
Here’s the three-part framework I use with every client:
- What we set out to do—the goal or objective for the period
- What happened—the data, in plain language
- What we’re doing about it—the recommendation or next action
Here’s what that looks like in practice:
| Dashboard-watching version | Analytics version |
| “LinkedIn engagement rate increased from 2.1% to 3.4%” | “LinkedIn content performed 62% better this quarter” |
| “We gained 340 new followers” | “Audience grew 12%, driven by our case study series” |
| “Impressions were up 28%” | “Content reached 28% more unique accounts—awareness is building” |
| “Our best post got 847 likes” | “Our most-engaged post drove 3x more profile visits and 14 inbound enquiries” |
The analytics version connects the number to something the business cares about. It also tells leadership what you plan to do with the information, which is what separates a reporting function from a strategic one (and moves you closer toward that promotion).
One more thing: don’t lead with follower count or impressions unless leadership has specifically asked for awareness metrics. These numbers look impressive but don’t connect to revenue, and experienced stakeholders know it.
Dive deeper
Social media analytics become more useful once you start asking: “what decision does this data need to help me make?”
You will never lack data, but you must connect what you find to the decisions your organisation needs to make.
Analytics thinking gets easier with training. Dive deeper in my guide to social media analytics training.